

Technical
3. The maturity roadmap
For: engineers and SREs · architects · team managers · business and productPrerequisites: Have read chapter 1 of the guide.
AI observability capability progresses through six levels (0 through 5). Each level builds on the previous one. An AI feature shipped without an explicit observability strategy stays at Level 0, and a simple log of calls moves it to Level 1. In my view, the realistic objective for a six-month program is Level 3. Level 5 is rare and signals an organization that treats observability as the engine of continuous improvement rather than as a passive monitoring layer.
This 0 to 5 ladder is the reference for every piece on this site: the maturity grid of the GenAI method and the 30-, 60- and 90-day milestones of the labs are read against these levels.
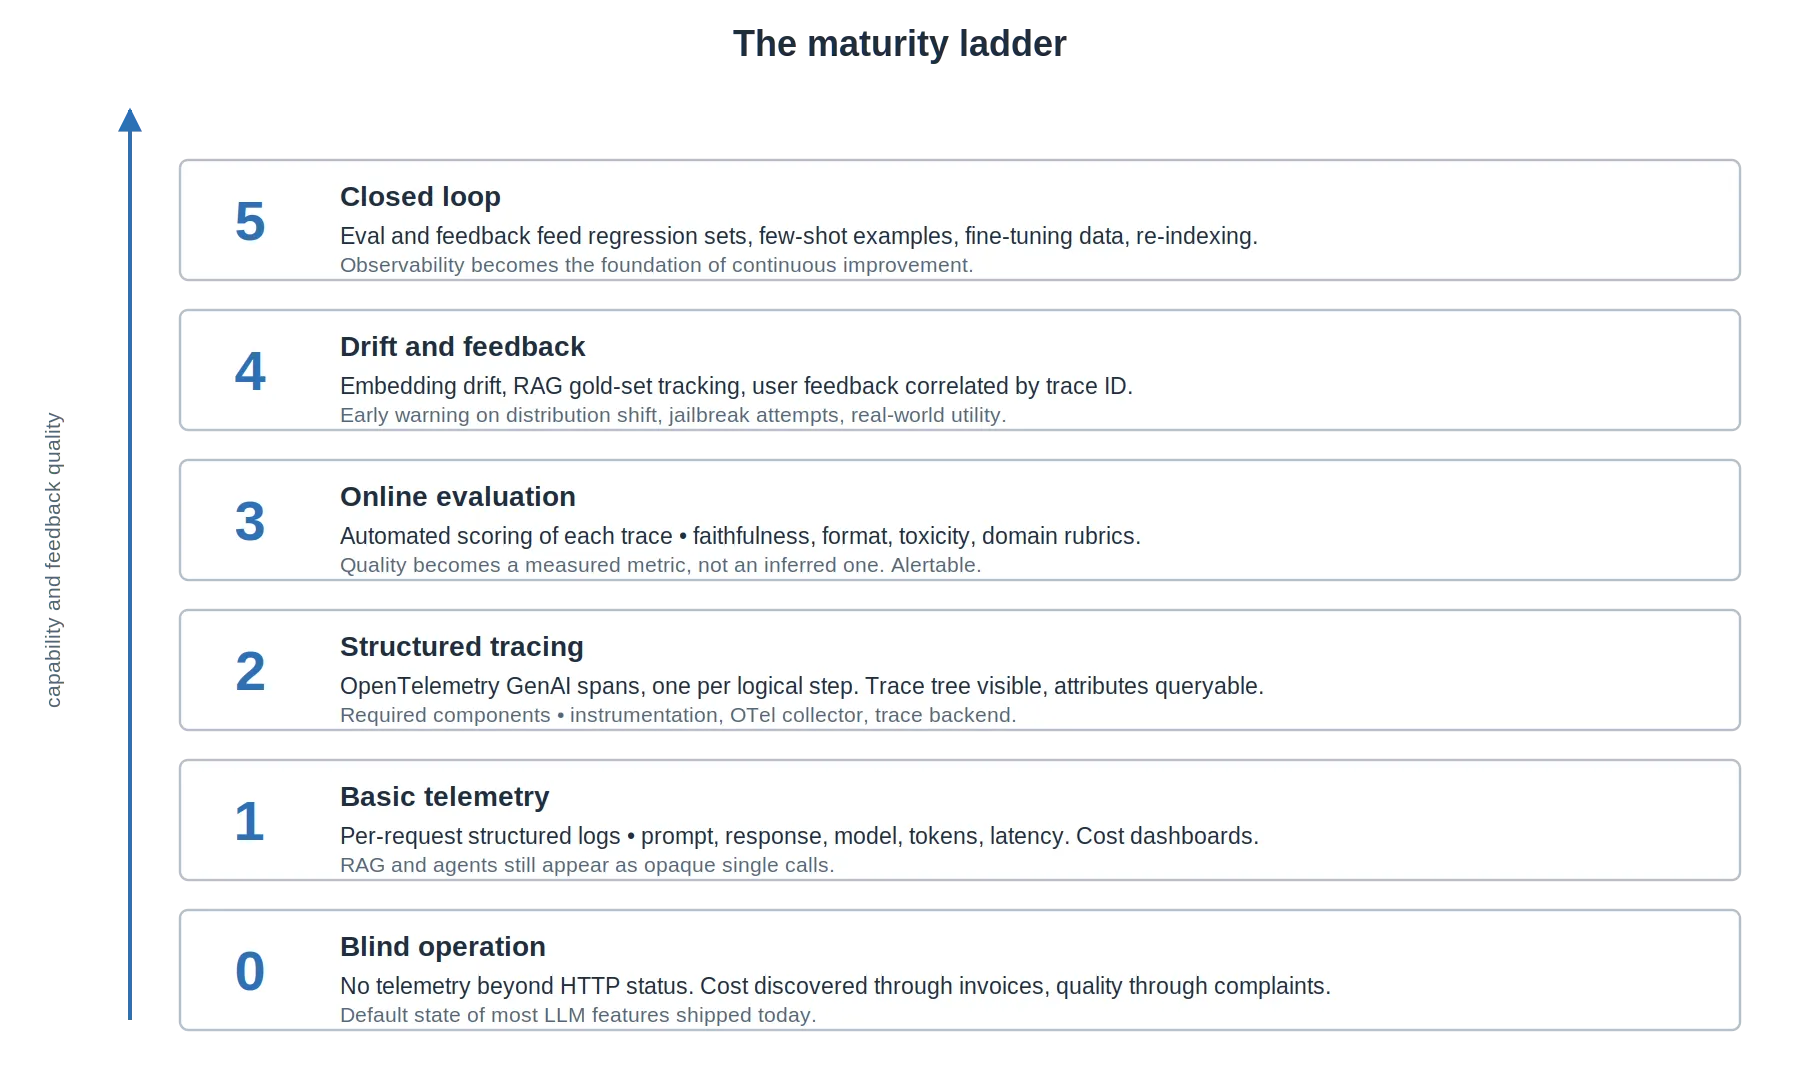
Figure 5. The maturity ladder, from Level 0 (blind operation) to Level 5 (closed loop). Level 3 is, in my view, a realistic six-month objective.
3.1 Level 0: blind operation
Section titled “3.1 Level 0: blind operation”The system runs in production with no telemetry beyond HTTP-level metrics. Cost is discovered through invoices at the end of the month. Quality is discovered through user complaints. This is the default state of an LLM feature shipped without an explicit observability strategy.
Indicators you are at Level 0
Section titled “Indicators you are at Level 0”- You cannot answer how many tokens were consumed yesterday by feature or tenant.
- You cannot retrieve the prompt and response of a specific user complaint.
- You discover hallucinations only through user reports.
- You have no baseline to compare against when upgrading the model.
- Your only available remediation is to revert.
3.2 Level 1: basic telemetry
Section titled “3.2 Level 1: basic telemetry”Per-request structured logs capture prompt, response, model identity, token counts and latency. Cost is computed and aggregated. Errors are tracked as metrics.
What you gain
Section titled “What you gain”- Cost attribution by feature, user, tenant or environment.
- Latency budgets per model.
- A searchable record of past requests for post-mortem analysis.
What you still lack
Section titled “What you still lack”- Multi-step execution is opaque: RAG and agents look like a single LLM call.
- No quality signal beyond user feedback.
- No drift detection.
- No way to gate changes by quality.
The risk at this level is to stop here and plateau: logs alone do not produce improvement. The leap to Level 2 is the leap that unlocks the rest.
3.3 Level 2: structured tracing
Section titled “3.3 Level 2: structured tracing”Adoption of OpenTelemetry GenAI semantic conventions. Each request emits a trace tree with one span per logical step. Spans are queryable by attributes including model, user, feature and tenant.
What you gain
Section titled “What you gain”- Visualization of RAG and agent flows as trace trees.
- Per-step latency breakdown.
- Standardized attributes across providers (no vendor lock-in at the data layer).
- Interoperability with existing OpenTelemetry infrastructure.
Required components
Section titled “Required components”- OTel-compatible instrumentation (native OTel SDKs, OpenLLMetry, or OpenInference, which exports over OTLP with its own attributes: see chapter 6).
- An OpenTelemetry Collector.
- A trace backend such as Tempo, Phoenix, SigNoz or Jaeger.
3.4 Level 3: online evaluation
Section titled “3.4 Level 3: online evaluation”Each production trace triggers automated evaluations. Evaluation results attach as attributes to the originating trace and as metrics for aggregation. Quality becomes a measured metric rather than an inferred one.
Common evaluators at this level
Section titled “Common evaluators at this level”- Faithfulness: is the answer grounded in the provided context?
- Answer relevancy: does the answer address the question?
- Format compliance: does the output match the required schema?
- Toxicity: presence of harmful content.
- PII leakage: presence of sensitive data in the output.
What you gain
Section titled “What you gain”- Continuous quality signal independent of user feedback.
- Alertable quality regressions, detected before users notice.
- A baseline against which to compare model and prompt upgrades.
3.5 Level 4: drift and feedback integration
Section titled “3.5 Level 4: drift and feedback integration”Three additions to a Level 3 platform.
- Embedding drift: monitor the distribution of input and output embeddings over time using KL divergence, Wasserstein distance or simpler population stability indices.
- RAG quality: track retrieval precision and recall against a maintained gold set, in batch.
- User feedback: capture thumbs, edits, retries and conversions, correlated with trace IDs.
What you gain
Section titled “What you gain”- Early warning when input distribution shifts (new use cases, jailbreak attempts, language changes).
- A reliable signal of real-world utility, not just rubric-based quality.
- Data to fine-tune retrievers, rerankers and prompt templates.
- Correlation between automated scores and user satisfaction (the most useful signal for tuning your evaluators).
3.6 Level 5: closed loop
Section titled “3.6 Level 5: closed loop”Evaluation and feedback data feed back into the system itself. This is what makes observability the engine of improvement rather than a passive monitor.
- Failed traces become regression test cases in CI.
- High-quality traces become few-shot examples or fine-tuning data.
- Drift triggers automated re-indexing or model re-selection.
- Feedback trains preference models or task-specific scorers.
- Model and prompt changes are gated on the regression dataset.
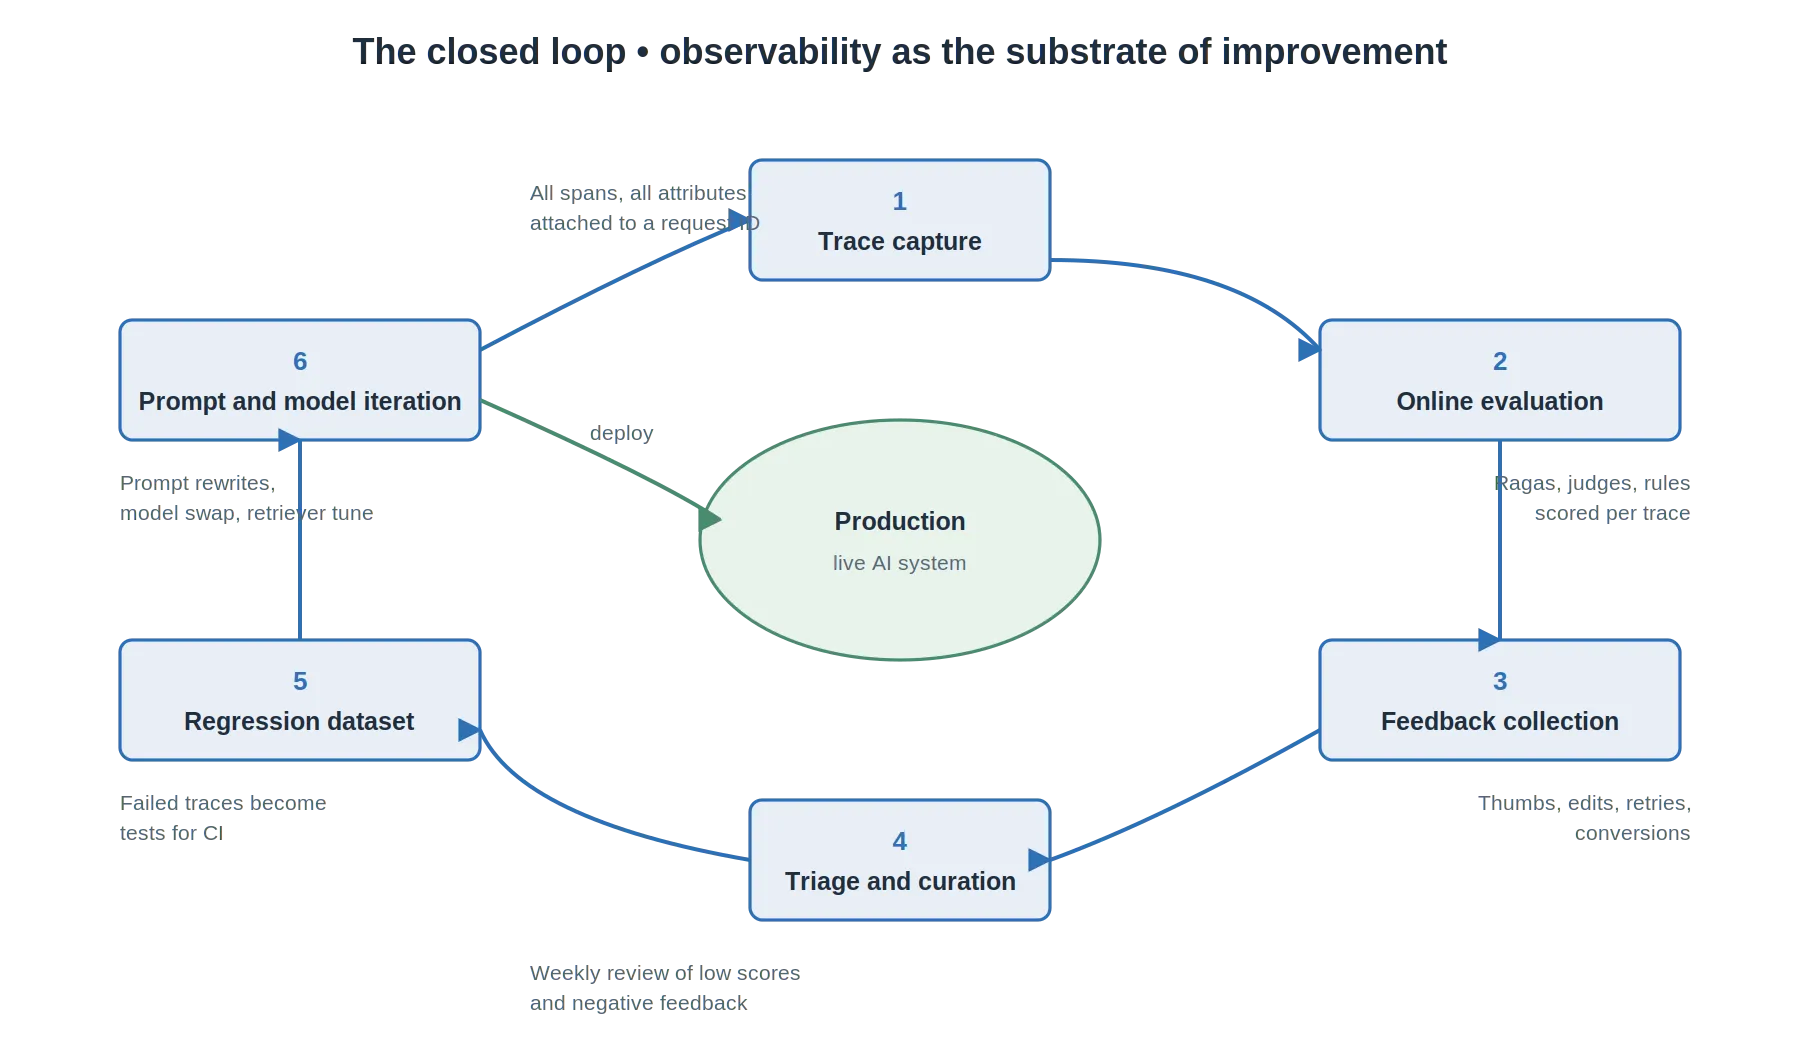
Figure 6. The closed loop. Production traces feed evaluation and feedback, which feed curation, which feeds prompt and model iteration, which deploys back to production.
Next: 4. Implementation in seven steps.
Revised on 4 October 2026: 0 to 5 ladder presented as the site’s reference, with links to the method and the labs.