

BusinessPractitioner7 min read (+1 technical)
Running the LGTM stack with a team of two
Mimir, Loki, Tempo and Grafana are rarely rejected for lack of power. Small teams give up because of everything around them. What that work costs, how a distribution can take it on. And when to choose something else.
For: architects · team managers · executives and CIOs · engineers and SREsPrerequisites: None. For the technical part, knowing what metrics, logs and traces are helps.
A mid-sized manufacturer runs about forty applications in its own data center. Two people look after the platform. They want to see what happens in production: how many requests, how many errors, how long each step takes. The data must stay on site, so a cloud service is out of the question.
They choose the Grafana stack, often called LGTM after its components: Loki for logs, Grafana for the screens, Tempo for traces and Mimir for metrics. A demo container runs in an afternoon. Then they read that it is intended for development, demos and testing. In production, there are four separate engines to install, plus a collector and Grafana, each with its configuration, its certificates and its upgrade cycle. Three months later, they have metrics, some logs and no traces. Nobody is sure the next upgrade will go well.
This page explains where that gap comes from, what it costs and how the open source project I am building tries to close it.
What is missing is not power
Section titled “What is missing is not power”Think of a professional kitchen. Buying the ovens is the easy part. What takes time is the plumbing, the ventilation, the safety checks, the maintenance schedule and making sure the dishes come out in the right order. The Grafana engines are excellent ovens. Small teams give up on everything around them.
In practice, a team that runs the stack by hand has to keep four configurations consistent with each other, wire Grafana so that a metric leads to the trace of a request and the trace to its logs, set up encryption and the separation between teams, follow four release cycles with a way back if an upgrade fails, watch the cardinality (the number of distinct series, which makes storage grow without warning when a label explodes) and monitor the monitoring stack itself. On many industrial or regulated sites, all of this must also work without internet access.
Large teams absorb that work. Small teams pay for it with time they do not have, or they choose another tool and give up on traces.
What it looks like when it works
Section titled “What it looks like when it works”Here is what those two people never got to see. A small simulated shop sends its metrics, logs and traces. About 5 % of payments fail.
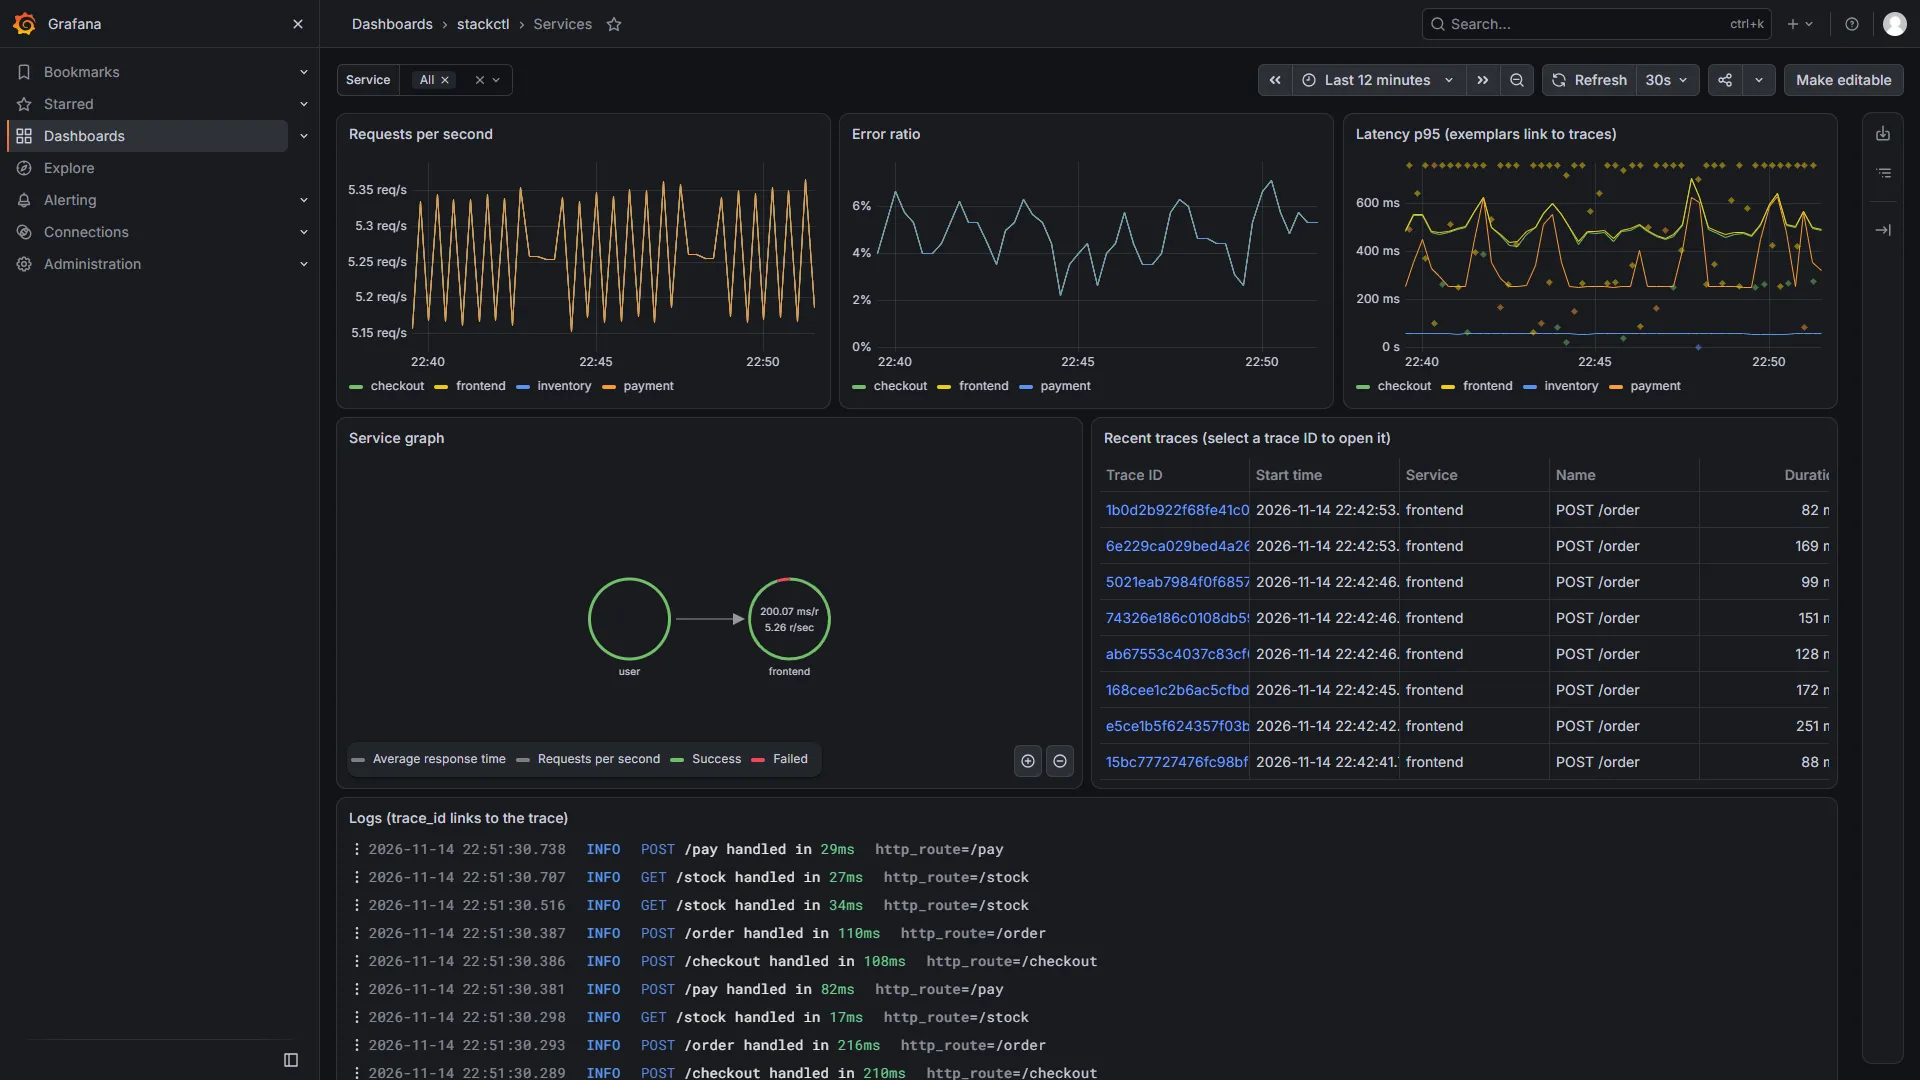
A customer writes: “my payment failed”. On the dashboard, the error ratio is not zero. Each dot on the latency panel is a real request. One click opens its trace, the path of the request through the four services. The payment service is shown in red. A second click displays the logs of that request (and only those) with the error message.
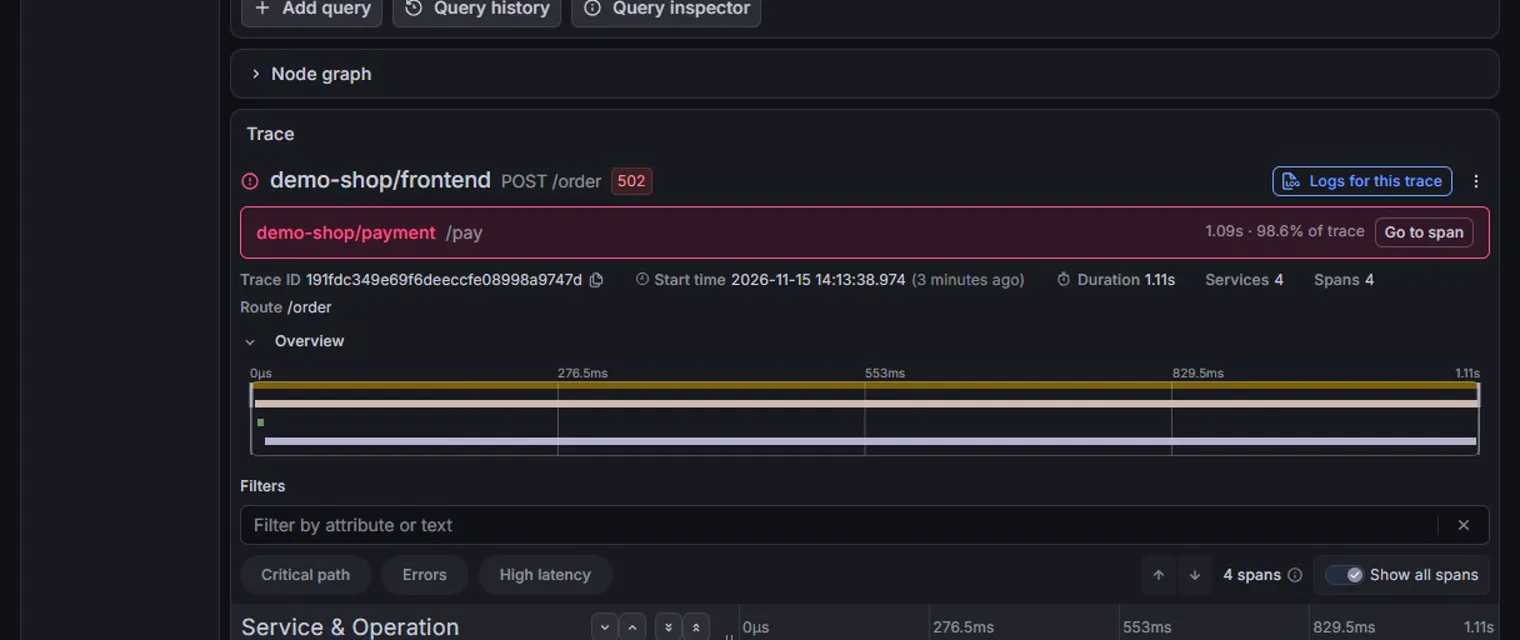
Nobody configured Grafana by hand for this. That path from symptom to cause is what small teams usually never reach, because it sits at the end of all the work listed above.
Doing for LGTM what k3s did for Kubernetes
Section titled “Doing for LGTM what k3s did for Kubernetes”Kubernetes did not become usable by small teams because someone rewrote it. Distributions such as k3s packaged it with sensible defaults, one install command and a clear lifecycle.
UniMetry, the open source project I am building, applies that idea to LGTM. A four-line file names the server. One command installs everything, checks that each service is healthy and prepares Grafana with its links and dashboards. On my test machine, it took about a minute and a half, without internet access. The machine was generous: the target set in the requirements is a working dashboard in under fifteen minutes on a modest server (4 processors, 8 GB of memory). It has not been measured yet.
The most important decision was what not to do. The tempting shortcut is to merge the engines into a single program. I chose to ship only the official, unmodified programs, at versions tested together. Security fixes from Grafana Labs apply directly, their documentation stays valid. Dashboards and alerts stay portable to a larger installation or to Grafana Cloud. Nobody is locked in, including by this project.
Every structural choice is written down as an architecture decision record, with the options I rejected and what the choice costs. There are fourteen of them so far, published with the code.
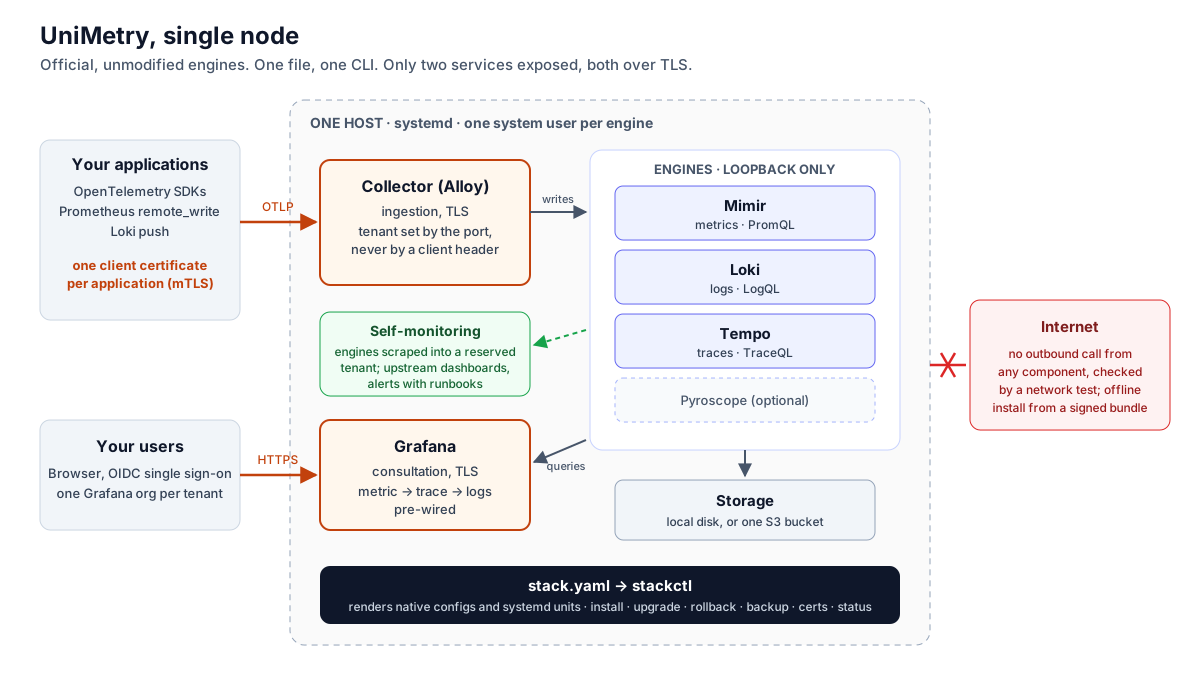
For technical teams: the architecture in a few decisions
The minimal configuration:
apiVersion: v1alpha1kind: Stacknetwork: hostname: obs.example.comstackctl install renders it into the native configuration of each engine (22 files on the test machine), generates the systemd units with one system user per engine, creates the certificate authorities and runs a health check on every service.
On a single server, the engines listen on loopback only. Two services are exposed over TLS: the collector (Grafana Alloy) for ingestion and Grafana for reading. Each tenant has its own listeners and its own certificate authority: the tenant is set by the port, never by a header sent by the client. A certificate from one tenant is refused by another at the TLS handshake.
The stack monitors itself with the upstream monitoring mixins, unmodified, in a reserved tenant. Storage is the local disk or one S3-compatible bucket. A Helm chart covers Kubernetes, with one instance per engine in the first version.
The repository has 17 end-to-end scenarios, among them upgrade and rollback including a failed upgrade, backup and restore after the loss of the machine, cardinality limits with alerts at 80 %, continuous profiling with Pyroscope, S3 storage, the Kubernetes chart, an offline install from a bundle signed with cosign, plus a network test that checks that no component makes an outbound call.
Where the money goes
Section titled “Where the money goes”No figure here would be honest without a pilot, so this is a frame for the discussion rather than an estimate. When a team assembles the stack itself, the cost sits in a few places that never appear on an invoice: the weeks of initial assembly, every upgrade and the risk of an outage that comes with it, the time lost during incidents because the signals are not linked, the problems on the monitoring tool itself that are found late, the storage that grows until the disk is full, then the security work postponed until an audit.
The distribution takes on most of that work: one file instead of the assembly, a set of versions tested together with upgrade and rollback in one command, signals linked from the first day, a stack that watches itself, cardinality alerts before the disk fills up, plus encryption, separation between teams and offline installation already in place. The engines are open source, with no licence per server or per gigabyte.
What remains for the team is real: deciding how long data is kept, watching what applications send, sizing the server. The tool does not replace that judgement. It removes the plumbing.
When to choose something else
Section titled “When to choose something else”This approach is not the right answer for every team. If you accept a cloud service and want no operations at all, Grafana Cloud runs the same engines for you, billed by usage, with your data hosted by a third party. If you want the smallest footprint, tools that fit in a single program, such as VictoriaMetrics or OpenObserve, are lighter, at the price of different query languages and of rewriting dashboards if you leave them later. If you run Kubernetes at scale with a team to own it, the official Helm charts give you everything, including all the work described above.
The distribution is for the case in between: the Grafana engines and their standard interfaces, on your own infrastructure, run by a small team.
What it is not, yet
Section titled “What it is not, yet”UniMetry is a prototype. The single-server scope of the first version is implemented and tested end to end and the Kubernetes chart is tested on a cluster, but there are no production users yet. The first version has no high availability, by design. Following the release cycles of four engines is a real maintenance load. Today there is one maintainer. The project’s own licence is still being finalised. The engines are under the AGPLv3 licence and the collector under Apache 2.0; they are redistributed unmodified.
UniMetry is an independent project, compatible with the Grafana stack and not affiliated with Grafana Labs.
What to do on Monday morning
Section titled “What to do on Monday morning”If you already run the stack by hand, count the hours your team spent on it last quarter outside of incidents: upgrades, certificates, configuration fixes. That figure is the baseline any tool, this one included, has to beat.
If you gave up on traces, ask the question again with the person who signs the budget: how long did the last serious incident take to understand? How much of that time went into searching across tools?
If you want to try, the repository contains the requirements, the decision records and a demo video of three and a half minutes.
Sources
Section titled “Sources”- Grafana Labs, all-in-one image
grafana/otel-lgtm, described as intended for development, demo and testing environments: github.com/grafana/docker-otel-lgtm - Licences: Mimir, Loki, Tempo (AGPLv3), Alloy (Apache 2.0)
- UniMetry, requirements, decision records and end-to-end tests: forge.erythix.tech/labstraining/unimetry/unimetry