

TechnicalPractitioner10 min read
OpenTelemetry close to the machines
The Collector speaks neither OPC UA, MQTT nor Modbus: how to build it a bridge, from the PLC to the zone boundary, without getting in the way of the process. Placement, data model, holding up at the edge, full example.
For: engineers and SREs · architectsPrerequisites: Knowing the Collector (receivers, processors, exporters): see OpenTelemetry end to end. Some OPC UA or MQTT background helps.
OpenTelemetry can collect shop-floor metrics and logs today, though not on its own. The Collector, the relay that receives data and forwards it, does not yet speak OPC UA, MQTT or Modbus, the protocols industrial equipment uses to exchange measurements: you have to build it a bridge. This article describes that bridge, from the PLC (the small computer that controls a machine) to the zone boundary, meaning the edge of the shop-floor network, with what actually exists in October 2026 and what is still to be written.
The question is no longer theoretical. Plants now run containers, edge gateways and now AI agents. IT teams, who run business computing, want the same traces, metrics and logs they get in the cloud. OT teams, who run the machines and automation, want nothing to touch the process. OpenTelemetry is, in my view, the neutral format best placed to serve both, provided it respects the constraints of the plant.
Two worlds of measurement
Section titled “Two worlds of measurement”IT and OT measure different things under different rules. Confusing them is the first reason industrial observability projects fail. In the table, a tag is a variable read from a PLC (a temperature, a pressure) and the historian is the database that archives those measurements.
| Dimension | IT (cloud native) | OT (shop floor) |
|---|---|---|
| Basic unit | Request, span, log line | Tag (process variable), alarm event |
| Model | Traces, metrics, logs | Sampled value series, states, alarms |
| Protocols | OTLP, HTTP, gRPC, Prometheus | OPC UA, MQTT and Sparkplug B, Modbus, Profinet, EtherNet/IP |
| System of record | Observability backend | Historian (PI, Canary, Timebase and others) |
| Clock | Timestamp at emission | PLC source timestamp, value quality |
| Priority | Service availability | Safety and process continuity |
| Lifecycle | Weeks | 10 to 30 years |
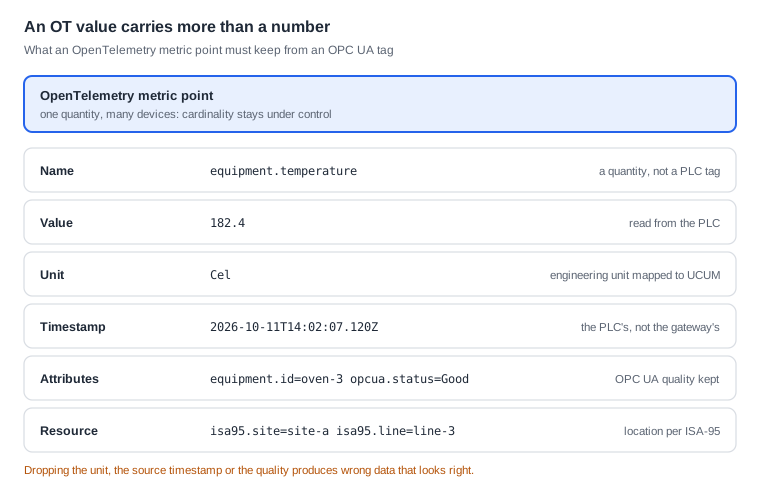
Two practical consequences follow. First, the historian remains the process system of record: OpenTelemetry does not replace it, it observes what surrounds it (gateways, edge applications, network, collection quality). Second, an OT value carries more than a number: a source timestamp, a quality code (good, uncertain, bad) and an engineering unit. A bridge that drops those three produces wrong data that looks right.
Where to place the Collector?
Section titled “Where to place the Collector?”The rule is simple: one Collector per zone and flows that only go up. The Purdue model and the IEC 62443 zones and conduits already provide the map; you only need to place the Collectors on it. The Purdue model arranges a plant network in levels, from the sensor up to business IT. IEC 62443, the industrial cybersecurity standard, splits that network into zones joined by controlled passages, the conduits.
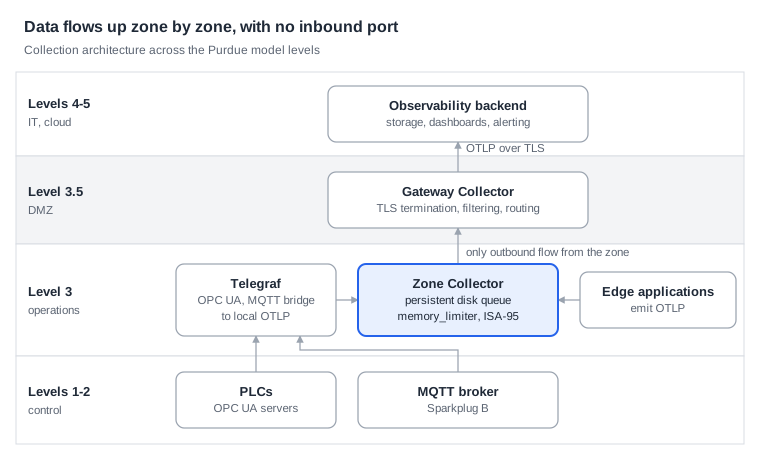
The zone Collector is the central piece: it receives locally, enriches, buffers on disk and opens the only outbound flow to the DMZ, the buffer zone between the plant and the rest of the company. The DMZ gateway Collector terminates TLS (it decrypts the traffic), filters what may leave the site and routes to one or more backends. No component at level 3.5 or above initiates a connection into the operations zone.
This split has an often underestimated benefit: it makes the conduit easy to justify to the CISO (the chief information security officer) and the OT team. One port, one direction, one documented protocol.
Bringing OT protocols into OpenTelemetry
Section titled “Bringing OT protocols into OpenTelemetry”The contrib Collector (v0.162.0), the version that gathers the community components, ships more than a hundred receivers, the components that read a data source. None of them handles OPC UA, MQTT, Sparkplug B or Modbus. The closest to the industrial world is the SNMP receiver, useful for shop-floor switches and network equipment, not for the process.
Three paths exist today.
| Path | Principle | Strengths | Limits |
|---|---|---|---|
| Third-party bridge to OTLP | An agent that already speaks OPC UA or MQTT (Telegraf, for instance) reads tags and exports OTLP to a local Collector | Works right away, proven protocol support | Two agents to maintain, attribute mapping to watch |
| Custom receiver | A Go receiver (gopcua or Paho libraries) compiled into an in-house distribution with the Collector Builder (ocb) | One binary, full control of the data model | Code to maintain, OPC UA security to get right |
| Native instrumentation | Edge applications (containers, light MES, agents) emit OTLP directly | Application traces and logs, not just metrics | Does not cover PLCs |
In practice teams combine the first and third paths. They only write a receiver when tag volume or security requirements justify it. Before writing one, check the community catalog kept by the OpenTelemetry Industrial initiative: it lists Modbus, OPC UA, MQTT and Sparkplug B or EtherNet/IP receivers developed outside contrib, at uneven maturity levels.
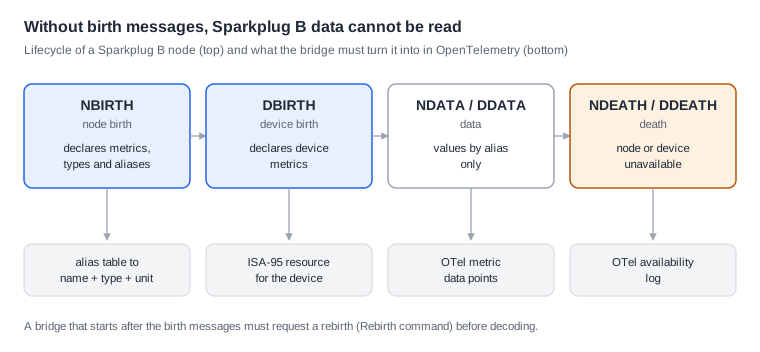
Sparkplug B deserves a separate note. It adds rules to MQTT, a lightweight messaging protocol widely used in industry, with birth messages (NBIRTH, DBIRTH) that declare metrics, their types and their aliases (short numbers that stand in for the names), then data messages that carry only the aliases. A bridge that ignores birth messages cannot decode the data. Death messages (NDEATH, DDEATH) are valuable: they become availability events to export as OpenTelemetry logs.
Modeling without betraying the process
Section titled “Modeling without betraying the process”OpenTelemetry semantic conventions define no industrial domain. The closest are hw.* for hardware and messaging.* for MQTT flows. You have to set your own rules and write them down before the first line of configuration.
Four rules hold up over time:
- The resource describes the location, not the variable. Site, area, line, cell and equipment go into resource attributes, following the ISA-95 hierarchy the plant already uses. A prefixed namespace (
isa95.site,isa95.line) avoids future collisions with official conventions. - The metric name describes a quantity, not a tag.
equipment.temperaturewith anequipment.idattribute beats a thousand metrics named after PLC tags. Avoid theprocess.*prefix: OpenTelemetry already reserves it for operating system processes. Cardinality stays under control and dashboards are reused from one line to the next. - The unit travels with the value. The OpenTelemetry
unitfield follows UCUM, a standard code for units of measure (Cel,bar,m3/h). OPC UA engineering units must be translated into it, not dropped. - Timestamp and quality come from the source. A data point’s timestamp must be the PLC’s, not the gateway’s. OPC UA quality becomes an attribute (
opcua.status). A bad value is exported as such rather than silently filtered.
Cardinality, meaning the number of distinct combinations a metric has to store, is the main risk. A plant often has tens of thousands of tags. Putting the tag identifier as an attribute on every point blows up the cost of any backend: the cardinality simulator shows the order of magnitude. Select the tags operations actually need and let the historian keep the rest.
Holding up at the edge
Section titled “Holding up at the edge”A shop-floor Collector must survive a network outage, a restart and an undersized machine, without ever getting in the way of the process. Five mechanisms are enough, all available in today’s Collector.
- Persistent queue. The
file_storageextension combined with the exporter’ssending_queuewrites data to disk while the outbound link is down. An outage of several hours on the WAN link, the network connection between the site and the rest of the company, drains without loss, within the allocated disk space. - Memory limiter. The
memory_limiterprocessor makes the Collector refuse data before it eats the RAM of a gateway shared with other applications. - Outbound flows only. The zone Collector pushes to the DMZ, never the reverse. No inbound port is opened into the control zone, which simplifies the IEC 62443 justification of the conduit.
- Minimal distribution. A distribution built with ocb, the tool that assembles a custom Collector, contains only the components in use. Less embedded code means a smaller attack surface and a lighter binary.
- Controlled remote management. The OpAMP extension and
opampsupervisormanage a fleet of Collectors remotely. In a constrained-egress zone, where outbound connections are strictly limited, the OpAMP connection starts from the edge and every configuration change goes through explicit validation.
Example: one OPC UA tag all the way to the DMZ
Section titled “Example: one OPC UA tag all the way to the DMZ”The example follows the first path: Telegraf, an open source collection agent, reads an OPC UA server and pushes OTLP to a local Collector, which enriches, buffers and exports to the DMZ gateway. The excerpts are deliberately short.
On the gateway, Telegraf reads one tag in signed and encrypted mode:
[[inputs.opcua]]  endpoint = "opc.tcp://plc-l3-01:4840"  security_policy = "Basic256Sha256"  security_mode = "SignAndEncrypt"  [[inputs.opcua.nodes]]    name = "equipment_temperature"    namespace = "2"    identifier_type = "s"    identifier = "Line3.Oven.Temperature"
[[outputs.opentelemetry]]  service_address = "127.0.0.1:4317"
The local Collector adds the ISA-95 location, protects memory and keeps data on disk during an outage:
extensions:  file_storage:    directory: /var/lib/otelcol/queue
receivers:  otlp:    protocols:      grpc:        endpoint: 127.0.0.1:4317   # loopback only
processors:  memory_limiter:    check_interval: 1s    limit_mib: 256  resource:    attributes:      - { key: isa95.site,  value: site-a, action: upsert }      - { key: isa95.line,  value: line-3, action: upsert }  batch: {}
exporters:  otlp/dmz:    endpoint: otel-gw.dmz.example:4317    tls:      ca_file: /etc/otelcol/ca.pem    sending_queue:      storage: file_storage      # persistent queue    retry_on_failure:      max_elapsed_time: 0        # never give up
service:  extensions: [file_storage]  pipelines:    metrics:      receivers: [otlp]      processors: [memory_limiter, resource, batch]      exporters: [otlp/dmz]
Three details matter more than the rest: the receiver listens on loopback only (it accepts connections from the machine itself and nothing else), the exporter is the only outbound flow from the zone and max_elapsed_time: 0 prevents data from being dropped during a long outage. Queue size must then be sized on the outage duration you need to cover.
What remains to be built
Section titled “What remains to be built”The approach works. Four gaps still slow adoption, though.
- No official industrial receiver. Community receivers exist outside contrib and the OpenTelemetry Industrial initiative lists them: Modbus, OPC UA (alpha, logs only at this date), MQTT and Sparkplug B, EtherNet/IP (experimental). None is part of the contrib Collector: every project still has to pick one, assess it and maintain it. A receiver carried by the project, with proper handling of birth messages and OPC UA security policies, would spare diverging implementations.
- No industrial semantic conventions. Without a shared vocabulary for ISA-95 location, value quality or machine state, dashboards cannot be shared from one site to another. OpenTelemetry Industrial has opened that work, still at the exploration stage.
- Little field experience with traces in OT. Metrics and logs work well. Traces make sense for edge applications and MES chains, much less for a PLC scan cycle. This ground is still to be explored.
- Fleet management is barely standardized. OpAMP exists and Margo already defines an OpenTelemetry Collector on the edge devices it manages. Yet the two are not yet joined up for thousands of constrained-egress sites.
Conclusion
Section titled “Conclusion”OpenTelemetry does not enter the plant to replace the historian or SCADA. It enters to observe everything that has been added around them: gateways, containers, edge applications and soon AI agents. The starting point comes down to three decisions: one Collector per zone, outbound flows only and a data model written before the configuration.
The rest is community work. An industrial receiver carried by the project and a first set of semantic conventions for OT would save the industry more time than any product. The OpenTelemetry Industrial initiative has taken this on: that is where to contribute.
Going further
Section titled “Going further”- OpenTelemetry in industry: where things stand: what drives adoption, what holds it back, where to start.
- The animated Collector pipeline: the memory limiter, filtering and batching in motion.
- What to monitor, from the factory floor to the AI model?: the field layer and the OPC UA quality code.
- Why does one detail blow up the metrics bill?: the cardinality risk, with numbers.
Sources
Section titled “Sources”Consulted on 11 October 2026.
- OpenTelemetry, contrib Collector module list, v0.162.0: more than a hundred receivers, none for OPC UA, MQTT, Sparkplug B or Modbus; SNMP receiver, OpAMP extension and supervisor present.
- OpenTelemetry, semantic conventions: existing domains, including
hw.*andmessaging.*; no industrial domain. - OpenTelemetry, exporterhelper: persistent sending queue and retry settings, including
max_elapsed_time. - InfluxData, Telegraf, inputs.opcua and outputs.opentelemetry plugins.
- Margo, specification (pre-draft), collecting observability data: at least one OpenTelemetry Collector on every device.
- Margo, sandbox: OpenTelemetry Collector on the device side.
- OpenTelemetry Industrial, an independent community initiative: catalog of projects and receivers and the state of each.