

Technical
4. Implementation in seven steps
For: engineers and SREs · architectsPrerequisites: Have read chapters 1 to 3 of the guide; basic OpenTelemetry notions.
Seven ordered steps to move a system from Level 0 to a working Level 3 platform. The order matters. Skipping steps produces a stack that emits data nobody queries.
Step 1: Define the questions first
Section titled “Step 1: Define the questions first”Before any instrumentation, write down the questions the platform must answer. The instrumentation strategy follows from the questions, not the reverse. A common failure mode is to instrument exhaustively and then realize that the high-cardinality attributes needed to answer the actual business questions were never captured.
Operational questions
Section titled “Operational questions”- What is the p95 and p99 latency of each pipeline stage, by tenant?
- Which feature consumed the most tokens last week, and how does that compare to the prior week?
- How often does the agent enter a loop of more than ten steps, and which tools are involved?
- What is the error rate of each MCP server, and is any single server dominating overall latency?
Quality questions
Section titled “Quality questions”- What is the faithfulness score of answers grounded in document set Z?
- What is the trend of toxicity flags over the past 30 days?
- Which prompt versions have produced regressions in the gold set?
- Is there a drift in input language distribution that correlates with quality drops?
Forensic questions
Section titled “Forensic questions”- Show me the full prompt and response for the request that user X submitted at time T (which assumes content capture has been explicitly enabled, with controlled access: see step 2).
- Show me all traces where the model output contained a credit card number pattern.
- Show me all traces that called the
billing.invoice_fetchtool with arguments containing tenant ID Y.
Set yourself an internal target for answering forensic questions, for example under one minute. No regulation imposes this figure; it is illustrative, but during an incident or an auditor’s request, forensic speed becomes a feature, not a side effect.
Step 2: Instrument
Section titled “Step 2: Instrument”Three options, in order of preference.
- Native OpenTelemetry GenAI instrumentation when available. The SDKs are still maturing but adoption is, in my view, the right long-term bet.
- Auto-instrumentation libraries such as OpenInference (Arize) or OpenLLMetry (Traceloop). These wrap common client libraries (OpenAI SDK, Anthropic SDK, LangChain, LlamaIndex) and emit spans automatically.
- Manual span creation around custom business logic that does not match a known framework.
Minimum capture per LLM call: model name, input tokens, output tokens, latency, error status; prompt and completion follow the content capture rule below. Additional useful attributes: temperature, top-p, system prompt hash, tool definitions, request ID, tenant ID, prompt version, retriever version.
OpenTelemetry GenAI semantic conventions: the core
Section titled “OpenTelemetry GenAI semantic conventions: the core”| Attribute | Type | Purpose |
|---|---|---|
gen_ai.operation.name | string | Operation type (chat, embeddings, retrieval, execute_tool, invoke_agent, etc.) |
gen_ai.provider.name | string | Provider identity (openai, anthropic, mistral_ai, etc.) |
gen_ai.request.model | string | Requested model name |
gen_ai.response.model | string | Model actually used (may differ from request) |
gen_ai.usage.input_tokens | int | Input token count |
gen_ai.usage.output_tokens | int | Output token count |
gen_ai.response.finish_reasons | string[] | Why generation ended (stop, length, content_filter, tool_call, error) |
gen_ai.input.messages, gen_ai.output.messages | structured, opt-in | Prompt and completion content (see the capture rule below) |
These conventions are still in development status, maintained in a dedicated repository since June 2026, and several attributes have already been renamed (for example gen_ai.system, the name used in the first version of this guide, now gen_ai.provider.name). The full attribute list, versions and renaming history are kept up to date in the production article, section 2: that is the site’s reference on this point.
Capturing prompt and response content
Section titled “Capturing prompt and response content”One rule across the site: content capture is off by default and only enabled explicitly (opt-in). This is also what the conventions say: gen_ai.input.messages, gen_ai.output.messages and gen_ai.system_instructions have the “Opt-In” requirement level and instrumentations should not capture them by default. For production, the specification recommends storing content outside telemetry, with its own access controls, and keeping only references on the spans; recording it in span attributes is better suited to pre-production or to cases where the telemetry storage complies with privacy rules. When content does flow through telemetry, it is masked in the Collector before storage (step 3). Enablement flags, events and Collector rules are detailed in the production article (specification).
Custom attributes should carry a prefix specific to your organization to avoid collision with future conventions. Example: acme.tenant_id, acme.prompt_version, acme.retriever.index_name.
Example: manual span for a RAG retrieval
Section titled “Example: manual span for a RAG retrieval”# Python pseudocode using opentelemetry.trace and hashlib# CAPTURE_CONTENT: configuration flag, False by defaultdef search(rewritten_query, tenant_id): with tracer.start_as_current_span("retriever.search") as span: span.set_attribute("acme.retriever.store", "qdrant") span.set_attribute("acme.retriever.top_k", 8) # By default: query length and digest, never the text span.set_attribute("acme.retriever.query_length", len(rewritten_query)) span.set_attribute("acme.retriever.query_sha256", hashlib.sha256(rewritten_query.encode()).hexdigest()) if CAPTURE_CONTENT: # explicit opt-in, off by default # text as an event, outside indexed attributes, masked in the Collector span.add_event("acme.retriever.query", {"text": rewritten_query}) span.set_attribute("acme.tenant_id", tenant_id) span.set_attribute("acme.retriever.index_name", "kb-prod-v3") chunks = vector_store.search(rewritten_query, k=8) span.set_attribute("acme.retriever.hits", len(chunks)) if chunks: span.set_attribute("acme.retriever.top_score", chunks[0].score) span.add_event("chunks", {"ids": [c.id for c in chunks]}) return chunksStep 3: Collect
Section titled “Step 3: Collect”Run an OpenTelemetry Collector between the application and the backend. The collector handles concerns that should not live in the application: batching, retry, back-pressure, attribute enrichment, filtering, sampling, redaction and fan-out to multiple backends.
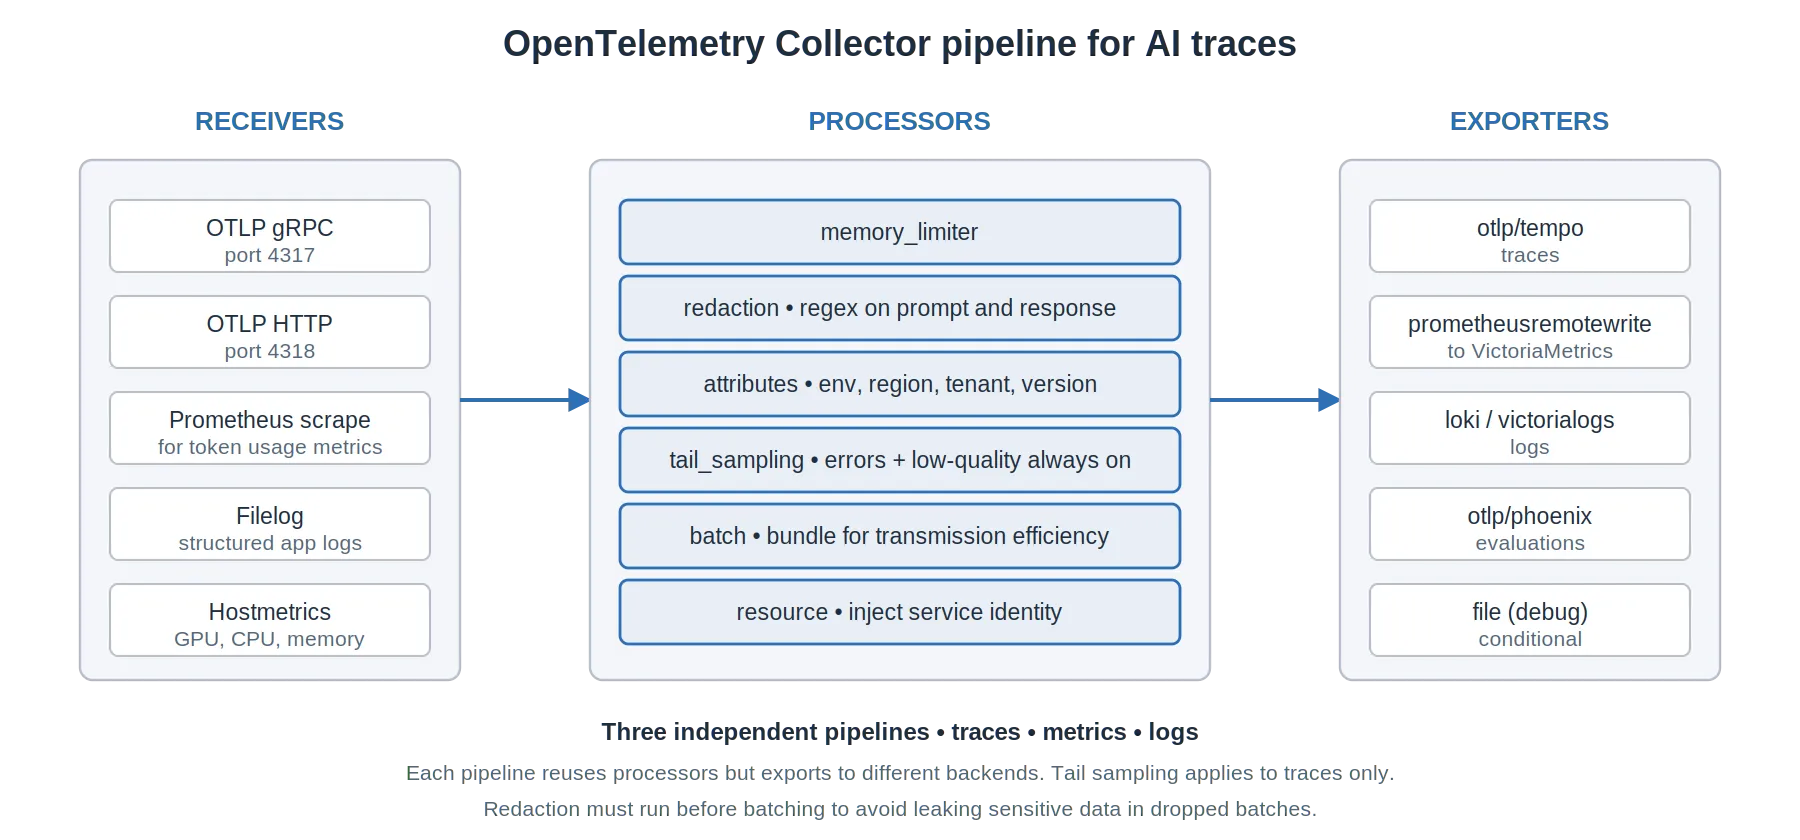
Figure 7. OpenTelemetry Collector pipeline. Receivers ingest data, processors transform it, exporters route to backends. Three pipelines run in parallel for traces, metrics and logs.
Critical processors for AI traces
Section titled “Critical processors for AI traces”memory_limiter: protects the collector from OOM under traffic spikes.redaction: attribute scrubbing before storage. It deletes attributes missing from an allow list of keys (allowed_keys), then masks or hashes values matching blocked regular expressions (blocked_values). It does not perform named entity recognition (NER): NER, like LLM-based scrubbing, requires an external component or a custom processor (processor documentation).attributes: inject environment, region, tenant and deployment version uniformly.tail_sampling: policy-based decision after the trace completes.batch: bundle spans for transmission efficiency. Goes last in the processor chain.resource: inject service identity and version into every span.
Step 4: Store
Section titled “Step 4: Store”Storage is split across signal types. A coherent stack picks one backend per signal and ensures they share trace ID indexing for cross-signal queries.
| Signal | Self-hostable software | Managed services (SaaS) |
|---|---|---|
| Metrics | Grafana Mimir, Prometheus, Thanos, VictoriaMetrics | Chronosphere, Datadog, Grafana Cloud, New Relic |
| Traces | Grafana Tempo, Jaeger, Phoenix (ELv2, source-available), SigNoz | Arize AX, Datadog APM, Grafana Cloud, Honeycomb |
| Logs | Elasticsearch, Grafana Loki, OpenObserve, VictoriaLogs | Datadog, Elastic Cloud, Grafana Cloud, Splunk |
| Evaluations | Attached to traces, aggregated as metrics | Same: this is convention, not product |
| Feedback | Event store keyed by trace ID | Same: custom-built |
| Cold archive | S3-compatible object store | S3, Azure Blob, GCS |
Options are listed alphabetically; chapter 6 details licenses and selection criteria. Storage decisions are driven by three constraints: retention policy, query latency on large prompt payloads, and data residency requirements. When a residency requirement applies (internal policy, sectoral regulator or contract), it often determines the stack.
Step 5: Evaluate
Section titled “Step 5: Evaluate”Two delivery modes for online evaluation.
- Inline: each request triggers evaluation synchronously. Adds latency. Used only when the evaluation result must gate the response (for example, a toxicity filter or a refusal classifier).
- Asynchronous: a background job samples traces and runs evaluation off the critical path. Default mode.
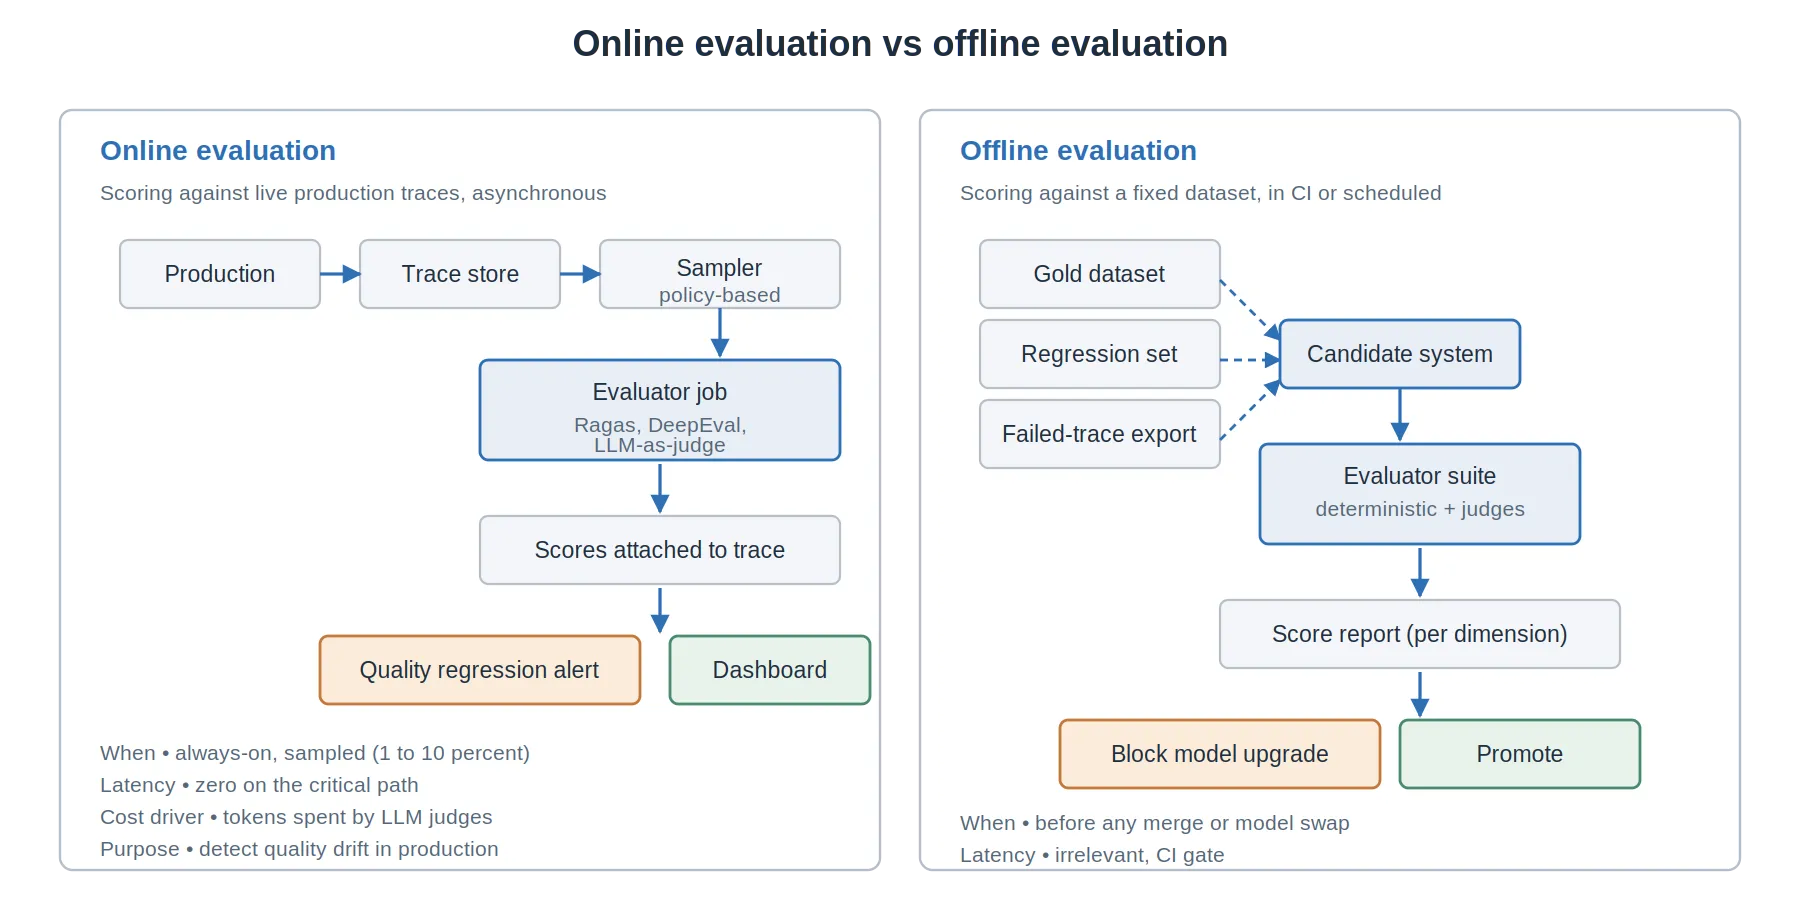
Figure 8. Online evaluation runs against live production traces. Offline evaluation runs against fixed datasets in CI or scheduled batches. Both are necessary: online for drift detection, offline for regression gating.
Chapter 5 covers evaluator design in depth, including LLM-as-judge prompt patterns, calibration and score aggregation.
Step 6: Visualize and alert
Section titled “Step 6: Visualize and alert”Build dashboards that answer the questions defined in Step 1. Group dashboards by audience and concern.
Dashboard families
Section titled “Dashboard families”- Cost and usage: tokens per feature, per tenant, per model, with anomaly bands.
- Latency and reliability: p50, p95, p99 per pipeline stage, error rate by failure mode.
- Quality and safety: evaluator scores over time, with regression alerts on quality drops.
- Drift and distribution: input length, language, topic distribution and embedding drift.
- Agent behavior: iteration histograms, tool selection frequency, loop indicators.
Alert conditions
Section titled “Alert conditions”- Quality regression beyond a threshold (for example, faithfulness drops more than two standard deviations).
- Cost spike beyond a baseline multiple (for example, tokens per minute exceeds 3x the trailing seven-day median).
- Latency degradation (p95 exceeds SLO for more than five minutes).
- Detection of PII or credentials in outputs (any non-zero count over a one-minute window).
- Agent loop indicator (more than ten iterations in any trace, consistent with the Step 1 question, or any iteration count above a per-feature ceiling).
Step 7: Close the loop
Section titled “Step 7: Close the loop”Without an explicit review process the data accumulates and nothing improves. Establish weekly rituals.
- Review of failed traces and low-score traces, with promotion to a regression dataset.
- Review of high-score traces, with promotion to a few-shot example set.
- Gate model and prompt changes on the regression dataset (no merge if evaluator scores regress).
- Review of user feedback signal trends, with action items on retrieval, prompts or model selection.
The closed loop is what distinguishes an observability platform from a logging system. Without it, you have an expensive read-only archive.
Next: 5. Evaluator design.
Revised on 2 October 2026: GenAI conventions moved to the semantic-conventions-genai repository (v1.42.0), content attribute history and finish_reasons values corrected, actual behavior of the redaction processor, position of the batch processor and exporter-side batching, neutral storage table columns.
Revised on 4 October 2026: conventions table reduced to the core, renaming history replaced by a link to the production article, content capture rule aligned with the specification (off by default, explicit opt-in, separate storage recommended in production).